
Viral launch videos for moon-shot founders 
Flowjam partners with AI founders and startups aiming for the moon, to create story-driven launch videos to build hype and show the world what they're building.












Flowjam works with some of the most successful AI founders in the world after only launching in 2023.
Copyright 2026. Flowjam Ltd.
Copyright 2026. Flowjam Ltd.
How to See Analytics on X: Free, on Mobile and Per Post
How to see analytics on X on phone and desktop, what is free vs Premium, why numbers shift for 36 hours, and which number to read after a launch.

Open one of your posts and tap the small bar-chart icon next to the view count. That's the post's analytics. The account-wide dashboard, with charts across all your posts, lives at x.com/i/account_analytics, and X has kept it behind Premium since June 2024.
The number you'll stare at is views. After a launch, it's the one that tells you least.
Is X analytics free?
Partly. The view count under every post is public and free. X added it in December 2022, and TechCrunch noted at the time that anyone can see it, not just the author. The lists of who liked, reposted and quoted a post are free too.
The account dashboard is not. When X relaunched it in June 2024, Social Media Today reported that trying to open the old analytics site now brought up a prompt to subscribe to Premium. In April 2025 X redesigned the per-post analytics page as well, and that redesign was reported as Premium-only too.
Guides written in 2026 disagree on how much per-post detail a free account still gets, and X changes this without much notice. Don't trust any guide on this, including ours. Tap the icon on one of your own posts and you'll know in five seconds what your plan shows.
How do I see analytics on my phone?
Same icon. In the X app, open the post and tap the bar chart beside the view count. For the account dashboard on a phone, open x.com/i/account_analytics in the browser. It works, but if you're comparing a dozen launch posts side by side, use a laptop.
Why do my numbers keep changing?
Because they aren't final yet. X's own help page for its post activity dashboard says metrics usually update “within a few seconds,” but that “our systems take up to 36 hours to stabilize, so you may see a slight fluctuation in data during that time.”
So a screenshot of your launch numbers at hour three is a snapshot, not a result. If you're posting a "here's how launch day went" thread, wait a day and a half before you quote numbers. (The X launch checklist covers what to set up before any of these numbers exist.)
What counts as a view?
Two different things share the word. The view count under a post counts how many times the post was shown. Nobody has to stop, click or read. The video view in X's media analytics is stricter: X's help page on Media Studio analytics says it counts when someone watches for at least 2 seconds with at least half the player on screen.
On a launch post with a video, the gap between those two is the most useful thing on the screen.
What should I look at after a launch post?
Not the view count. It's the biggest number on the screen and the one founders refresh all day, and it tells you the least. A launch post can be shown 50,000 times to people who scroll straight past it. What you want to know is whether strangers stopped, got curious, and went somewhere. Each of those shows up in a different number at a different time, so read them in order.
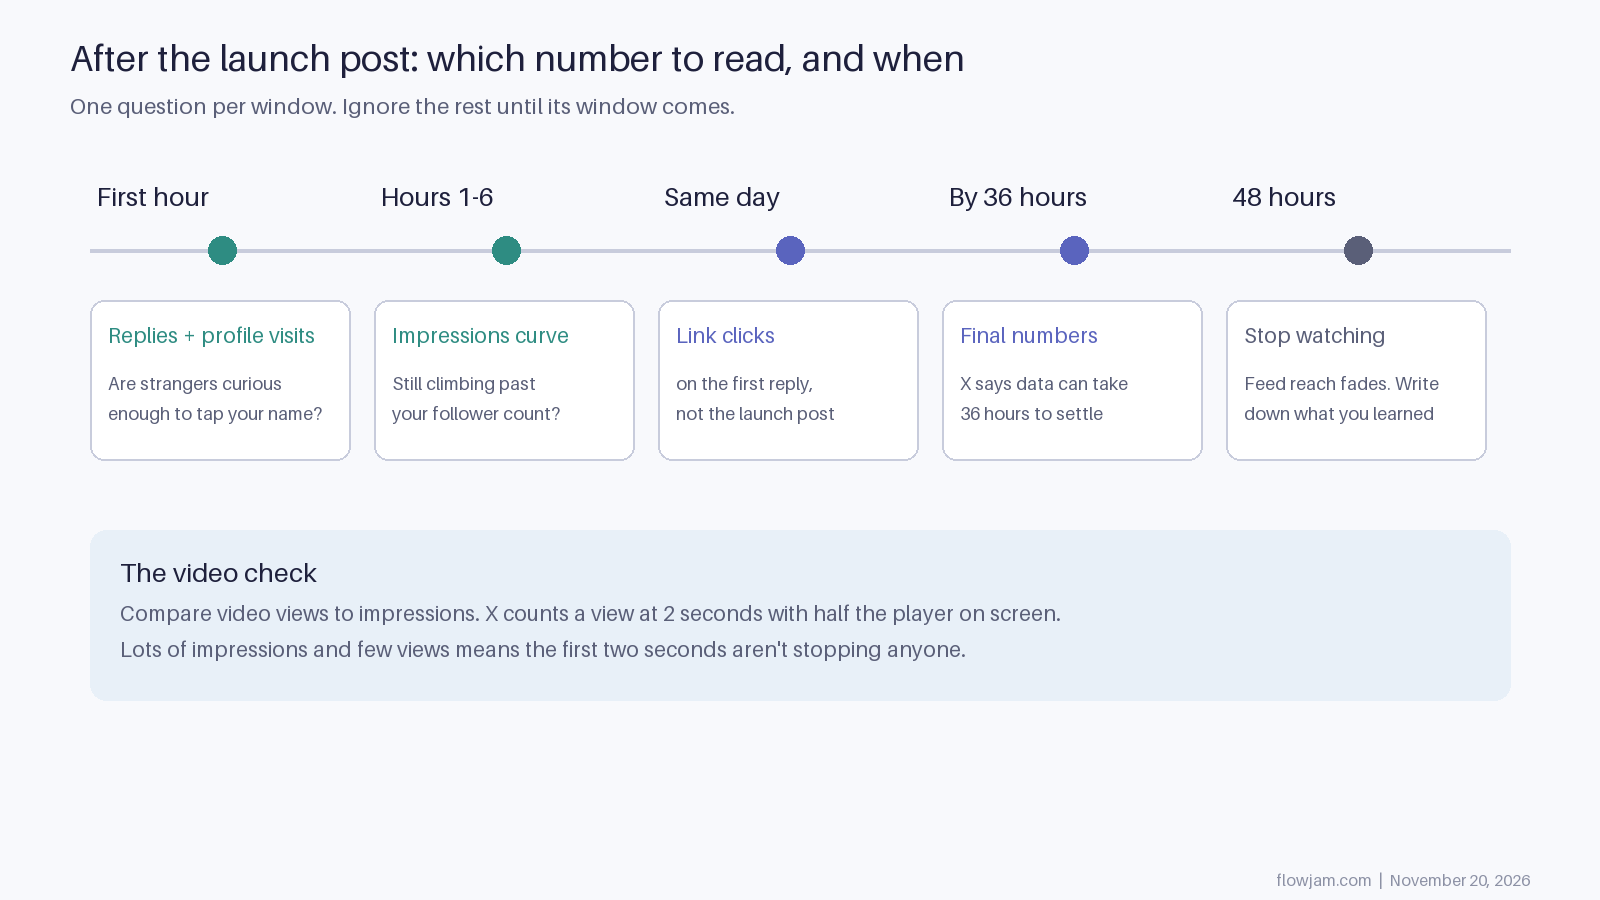
- First hour: replies and profile visits. A reply means someone had something to say. A profile visit means someone wanted to know who made this. Both are curiosity. Answer every reply.
- Hours one to six: whether impressions keep climbing after they pass your follower count. If they flatten near your follower count, the post stayed inside your own audience. If they keep going, X is showing it to people who don't follow you.
- Same day: link clicks, on the right post. We put the product link in the first reply rather than the launch post, so the clicks that matter show up on the reply's analytics. Founders open the launch post, see almost no link clicks, and panic. Check the reply.
- By 36 hours: the real totals, for the reason above.
- After 48 hours: stop refreshing. The ranking code X has published in its x-algorithm repository drops posts out of the main For You candidate pool after 48 hours, so most of the reach a launch post will get has happened by then. Write down what worked and close the tab.
Compare the post's video views to its impressions. A lot of impressions and few video views means the post was shown plenty but the first two seconds didn't make anyone stop. No amount of reposting fixes that. It's the opening of the video. A healthy number of views but few profile visits means people watched but the video never made clear what the product is or why it matters to them.
Both are video problems, and they're the part of a launch that's hardest to judge yourself, because you already know what your product does. You can't watch your own video the way a stranger does, for the first time with no context. That is what we work on at Flowjam. We find the moment in your product that makes a stranger stop, and build the launch video around it. Our story-driven launch videos have averaged over 100,000 views with no media budget. If your numbers tell you the video isn't stopping people, see the launch videos we've made.
For the posts around the numbers, our guide to launching on X covers launch day hour by hour.
Can I see analytics for someone else's post?
Only what's public: the view count, likes, reposts, quotes, replies and bookmarks. Profile visits, link clicks and the rest of the breakdown are visible only to the account that posted. Any tool claiming to show you a competitor's link clicks is guessing.
AP
About the author
Adam Petty
Founder, Flowjam
Adam is the founder of Flowjam, where he helps startups turn ideas into launch videos, product demos, and ads with AI video. He writes about AI video production, creative workflows, and go-to-market for early-stage teams.
Frequently asked questions
Are promoted and organic numbers shown separately?
Yes. X's help page for its post activity dashboard says a promoted post gets two rows: one with organic-only metrics and one labelled as promoted, summed across all the campaigns it ran in.
Can I export my X analytics?
X's help page for its post activity dashboard says you can export a CSV with organic and promoted metrics split out, up to 30 days at a time and up to 3,000 posts per file.
Can I see who viewed my post on X?
No. X shows how many times a post was viewed, not who viewed it. You can see who liked, reposted or quoted it.


Launch videos for
moon-shot founders.

About
We're a video production studio partnering with AI founders and startups. We make launch videos to show the world what you're building.
London / San Francisco
Studio in London, UK. Also in San Francisco, working with clients worldwide.
Contact
Adam Petty
Founder
adam@flowjam.com
Founder
adam@flowjam.com